How to Measure Relative Strength (and Why It Finds the Market's Leaders)
"Relative strength" is one of the most used — and most misunderstood — phrases in momentum investing. Here's what it actually measures, how to calculate it, and how to use it without fooling yourself.
The two "relative strengths"
Before anything else, clear up the single biggest source of confusion: the phrase "relative strength" means two completely different things, and they get used interchangeably in forums, newsletters, and even brokerage apps.
Relative strength (RS) — the topic of this article — compares one stock's performance to another stock's, or to the market as a whole. A stock with high relative strength is simply outperforming whatever you're comparing it against. It answers the question: who is leading?
Relative Strength Index (RSI) — a different tool entirely — is a momentum oscillator invented by J. Welles Wilder Jr. It produces a number between 0 and 100 that measures the speed and size of recent price changes on a single stock, with levels near 70 often described as "overbought" and near 30 as "oversold."
Two momentum tools, one shared word, totally different jobs. RSI tells you whether a single stock has moved fast and far in a short window. RS tells you whether it is beating the field. Momentum investors care about both, but they screen with relative strength — because leaders are, by definition, found relative to everyone else.
What relative strength actually measures
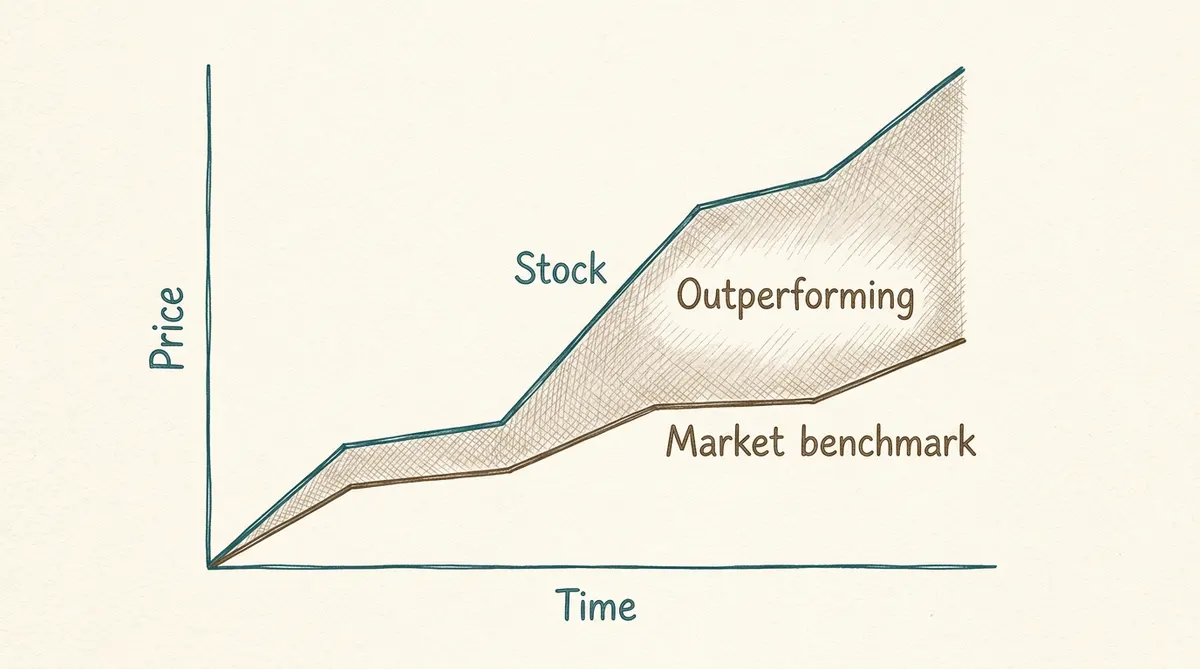
Relative strength is a comparison, and the comparison is the whole point. A stock that rises 10% in a month sounds good — until you learn the market rose 15% and the stock's peers rose 30%. That stock is falling behind, even as it goes up. Relative strength turns that intuition into a number.
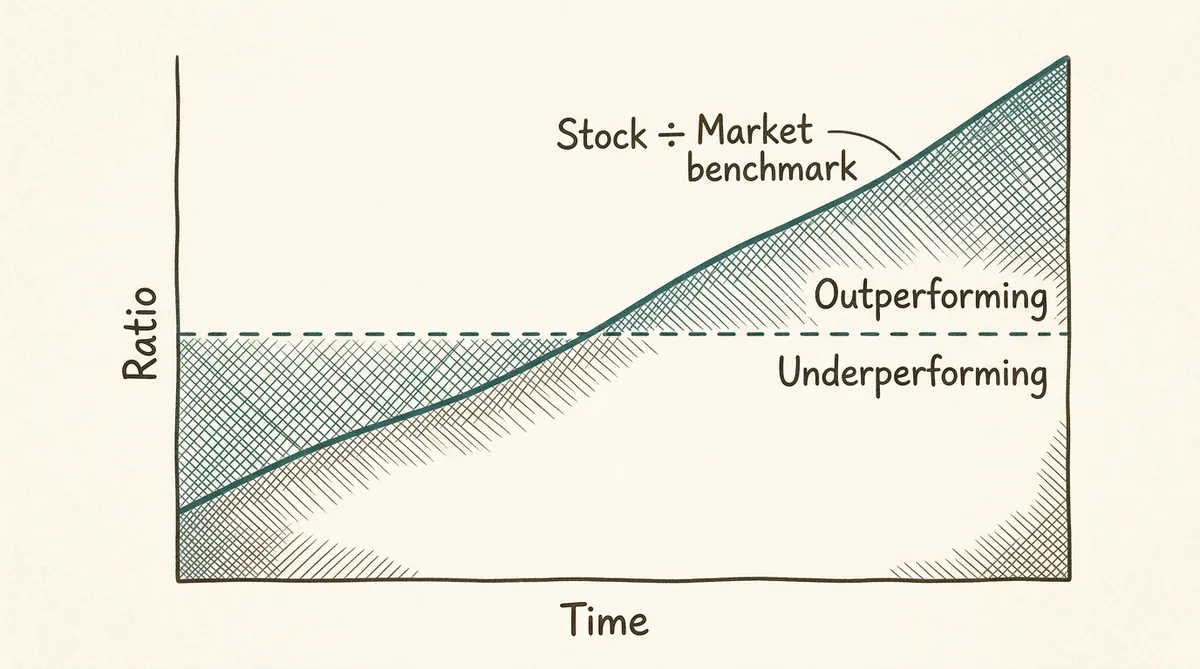
The most common form is a simple ratio:
Stock's performance over a period ÷ benchmark's performance over the same period
If the ratio is rising, the stock is outperforming; if it's falling, it's underperforming. The benchmark is usually a broad market index (like the S&P 500) or a peer group. The lookback is usually a few months — long enough to smooth out noise, short enough to catch a trend while it's still young.
The key insight is that relative strength is about position, not level. A stock doesn't need to be at an all-time high to have strong RS — it needs to be doing better than the market while the market is doing whatever it's doing. That's why RS is so prized by momentum investors: it surfaces leadership early, before it becomes obvious.
Why leaders keep leading
Relative strength isn't just a ranking trick. It rests on one of the best-documented patterns in markets: the momentum effect. Stocks that have outperformed over the past several months have, on average, tended to continue outperforming over the following months. The effect has been documented across decades, countries, and asset classes, and it survives because it's rooted in human and institutional behavior.
- Good news travels slowly. When a business genuinely improves, investors underreact at first. The stock grinds toward its new fair value over months — and that grind is outperformance.
- Big money moves slowly. Institutions building a large position can't do it in an afternoon. Their accumulation creates steady, quiet demand that keeps a strong stock strong.
- Attention follows success. A stock that's been outperforming shows up on more screens, more watchlists, and more analysts' desks — bringing in new buyers in waves.
Relative strength, in other words, is often the visible footprint of a real business improvement being recognized gradually. It's a way to notice that recognition happening and put it in context — not a promise about what happens next.
How to measure it, practically
You don't need a spreadsheet to understand relative strength, but it helps to know what the common implementations are actually doing:
- The ratio line. Divide the stock's price by the benchmark's price and plot the result. A rising line means outperformance, whatever the market is doing. This is the classic, and it's easy to eyeball once you know what to look for.
- Ranked returns. Sort a universe of stocks by their return over a set window — 1 month, 6 months, 12 months — and take the top slice. This is relative strength as a screen rather than a single line: you're not asking "how strong is this stock?" but "who is strongest right now?"
- Percentile or rating. Some tools convert performance into a 0–100 score showing where a stock sits relative to the entire market. A 90 means it has outperformed roughly 90% of the universe over the lookback.
- Trend-based measures. Where a stock sits relative to its own long-term moving averages — and whether those averages are rising — is a cousin of relative strength that captures trend structure alongside raw outperformance.
The common thread is a consistent lookback and a relevant benchmark. Change either and the number changes meaning. A 3-day relative strength reading is mostly noise; a 12-month reading is mostly history. Somewhere in the middle is where leaders show up while the trend is still intact.
The mistakes that cost people
Relative strength is powerful, but it's easy to misuse. Four errors come up again and again:
- Confusing RS with RSI. An "oversold" RSI reading is not the same as weak relative strength, and a stock can have a high RSI and weak RS — or vice versa. Know which tool you're holding.
- Too short a lookback. Over a few days, everything looks strong or weak by luck. Real relative strength is measured in months.
- The wrong benchmark. A small-cap stock compared against the S&P 500 is being measured against large caps it was never going to track. Compare like with like, or use a broad, consistent reference and stick with it.
- Using RS as a buy signal on its own. Relative strength tells you who is leading — it doesn't tell you whether the entry is sensible, the trend is intact, or the risk is worth it. It's a filter and a starting point, not a reason to press the button.
Putting relative strength to work
Here's the practical problem relative strength was invented to solve: thousands of US-listed stocks and ETFs are trading on any given day, and only a small number are genuinely leading the market at any moment. Finding them by hand means comparing every name against the market — a job that's arithmetically impossible to do well by eye.
This is the kind of research Relaxfolio is built to support. Ask in plain English and review the results:
- "Trending stocks" — uptrending names ranked by momentum potential, with relative strength context and how far each sits from its long-term trend measures.
- "New up trends" — stocks crossing above their long-term moving averages, a moment that often marks the start of a new leadership phase.
- "Breakout stocks" — names moving through established resistance, which you can then assess for whether strength is isolated or shared.
Two things make this more useful than a raw ranking. First, the theme context: Relaxfolio groups related companies by the economic or technological force behind them, not only by sector and industry. That lets you ask whether leadership is confined to one stock or shared across suppliers, enablers, and adjacent beneficiaries of the same premise — a very different signal from a single name popping on its own. Second, you can save a screen and receive updated results by email for ongoing review, so a defined research process stays in view without manual rebuilding. The investor still decides which evidence matters and how to act on it.
A relative-strength checklist
Before you lean on relative strength, run through five questions:
- Am I measuring relative strength (vs. a benchmark) and not RSI?
- Is my lookback long enough to be meaningful — several months, not a few days?
- Is my benchmark relevant and consistent from one reading to the next?
- Is the stock's trend still intact (price above a rising long-term average)?
- Is the strength isolated, or shared across related companies in the same theme?
Five considered answers will tell you more than any single number. Relative strength won't tell you what to buy — but it will reliably point you at the names worth a second look.
Continue the momentum series: Momentum Investing 101, How to Find Breakout Stocks Before They Run, and Riding the Trend: Buying Pullbacks and Knowing When to Sell.
See how relative strength surfaces the market's leaders — ask "trending stocks" or "new up trends" for a structured view. Explore momentum research → · Open Relaxfolio →
This article is for educational purposes only and is not investment advice. All investing involves risk, including possible loss of principal.
Put this into practice tonight
Ask Relaxfolio in plain English and get a researched answer in minutes.
Get started