How to Find Breakout Stocks Before They Run
Big moves don't come from nowhere. Learn to read the quiet buildup that comes before the explosion.
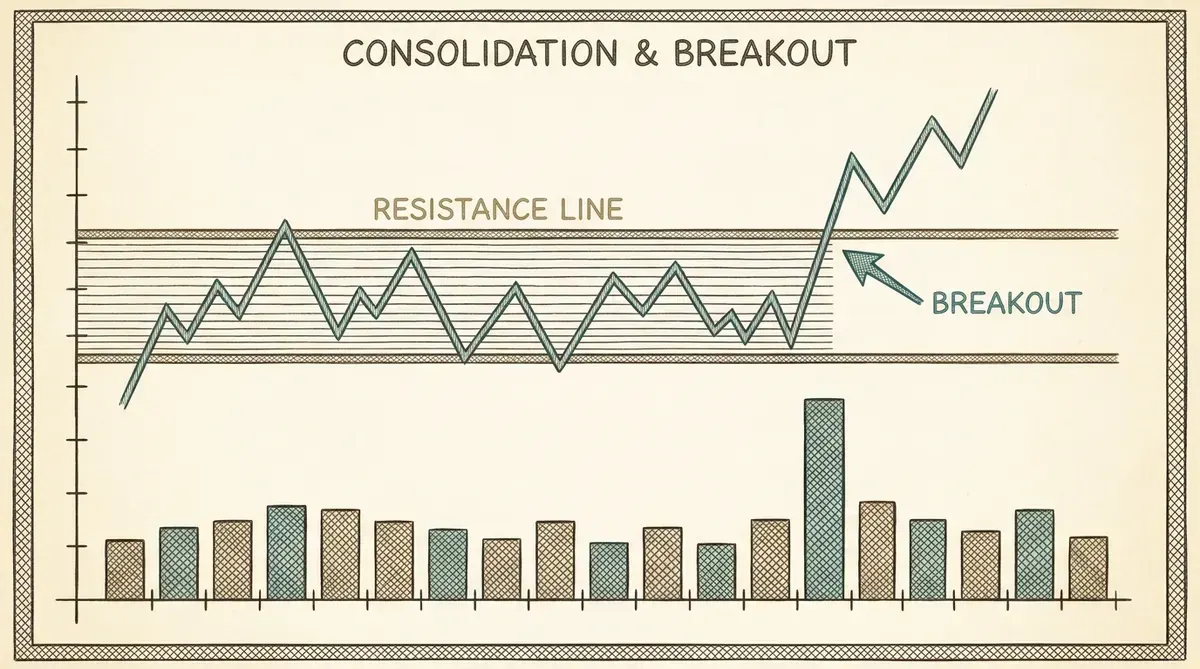
What a breakout actually is
Watch enough charts and you'll see the same movie on repeat: a stock trades sideways for weeks or months, pinned under some price ceiling. Then one day it punches through that ceiling on a surge of volume — and instead of falling back, it keeps going. Sometimes for months.
That's a breakout, and it's one of the most studied entry points in trading because it marks the exact moment a stock's supply-and-demand balance visibly flips. Understanding why it works matters more than memorizing patterns, so let's start there.
The psychology of the ceiling
Imagine a stock that ran from $30 to $50, then pulled back and spent four months bouncing between $42 and $50. What's actually happening in that range?
Every time the stock nears $50, sellers appear. Who are they? People who bought near $50 earlier and swore they'd "get out at breakeven." Traders taking profits. Skeptics shorting the "double top." Their selling forms overhead supply — a shelf of shares for sale that demand has to chew through.
Now here's the key: every failed attempt at $50 consumes some of that supply. The breakeven sellers sell — once — and they're gone. If the stock keeps returning to $50 instead of collapsing, it means buyers are patiently absorbing everything sellers throw at them. Usually that patience belongs to institutions quietly building positions.
The day the shelf is empty, something remarkable happens: price moves through $50 and finds... almost no sellers left. The stock can rise on comparatively little effort. Shorts scramble to cover, breakout traders pile in, and the move feeds itself. A breakout is what it looks like when the last seller at a price level has already sold.
The setups worth knowing
You don't need an encyclopedia of patterns. These three cover most real-world breakouts:

- The ascending triangle. A flat ceiling with rising lows beneath it. Buyers are getting more aggressive — stepping up at higher and higher prices — while the supply at the ceiling shrinks. This is the pattern of demand winning a war of attrition, and it's among the most reliable bullish setups.
- The flat base. The stock simply moves sideways in a tight range for six weeks or more, often after an earlier advance. Boring is the point: it means the stock refuses to give back gains, and strong hands are holding.
- The volatility squeeze. Price swings get narrower and narrower, volume dries up, the stock goes quiet. Markets alternate between contraction and expansion — a long, tight squeeze is a spring being loaded. When it resolves upward on volume, moves can be violent.
Two things make any of these setups more trustworthy: the stock is already in a long-term uptrend (breakouts within Stage 2 trends succeed far more often than bottom-fishing breakouts), and the base formed on declining volume (sellers exhausting, not gathering).
Volume: the lie detector
Price can lie. A stock can poke above resistance for an afternoon because of one careless market order. Volume is much harder to fake.
On a genuine breakout you want to see volume expand meaningfully above its recent average — ideally 1.5–2x or more. This is the machine-readable signature of institutional buying: big players choose that moment to commit, and their size shows up in the tape. A breakout on limp volume is a party no one attended; treat it with suspicion.
Traders formalize this with relative volume — today's volume divided by the average. It's one of the first columns to check on any breakout candidate list.
False breakouts and how to survive them
Some breakouts fail. Price pops above the ceiling, sucks in buyers, then slides back into the range — trapping everyone who chased. You can't avoid them entirely, but you can tilt the odds:
- Demand the volume confirmation. Most traps are low-volume moves.
- Prefer strong markets. When the overall market is trending up, breakouts follow through far more often. In choppy or falling markets, breakout failure rates soar — that's a fact to respect, not fight.
- Check the calendar. Never take a breakout into an earnings report you didn't know about. A scheduled coin-flip is not a setup.
- Define failure in advance. If price falls back into the base decisively, the breakout is invalid — exit. Your stop-loss goes just below the breakout level or the most recent low. Losses on failed breakouts should be small and boring.
The beautiful property of breakout trading is its asymmetry: a failed breakout costs you a few percent, while a real one can begin a 50–100% advance. You don't need to be right most of the time. You need to be positioned when it matters and small when it doesn't.
The daily hunt — and how to automate it
Here's the workload problem: bases take months to form, but the breakout itself happens in a single day. To catch breakouts consistently, someone has to check the entire market for them every day. Doing that by eye across thousands of stocks isn't a discipline problem — it's an arithmetic problem. You can't.
This is where Relaxfolio earns its keep. Its research runs after every US market close, and pattern detection — ascending triangles, tightening ranges, fresh breakouts, trend status — is part of the standard analysis. You just ask:
- "Breakout stocks" — names breaking out now, ranked by momentum potential, with relative volume and theme context. Rather than relying only on a sector or industry label, compare companies linked by the same technology, demand driver, or value chain. Several related breakouts may warrant a different research question from a single-company move: is the underlying theme attracting broader participation?
- "Upward channels" — trending stocks approaching buy points within their channels.
- "Upcoming earnings" — so you never take a setup into a surprise report.
Save your breakout scan as a favourite and the refreshed list lands in your inbox after each close. The months-long patience stays yours; the nightly scanning is handled.
A simple starting checklist
Before acting on any breakout, ask five questions:
- Is the stock in a long-term uptrend (above its major moving averages)?
- Did the base last at least several weeks, with volume drying up inside it?
- Is today's breakout volume well above average?
- Is the overall market in decent shape?
- Do I know exactly where I'm wrong (my stop), and is the position sized so that being wrong is trivial?
Five yeses is a trade. Anything less is a pass — there will be another breakout tomorrow. There always is.
Next in this series: Riding the Trend: Buying Pullbacks and Knowing When to Sell.
Use "breakout stocks" to review candidates across the US market, together with ranking and contextual information. Explore Relaxfolio →
This article is for educational purposes only and is not investment advice. All investing involves risk, including possible loss of principal.
Put this into practice tonight
Ask Relaxfolio in plain English and get a researched answer in minutes.
Get started