The Anatomy of a High-Probability Swing Setup
Amateurs look for stocks that might go up. Professionals look for structures where the risk is defined and the odds are tilted. Here's the difference, piece by piece.
A setup is not a stock
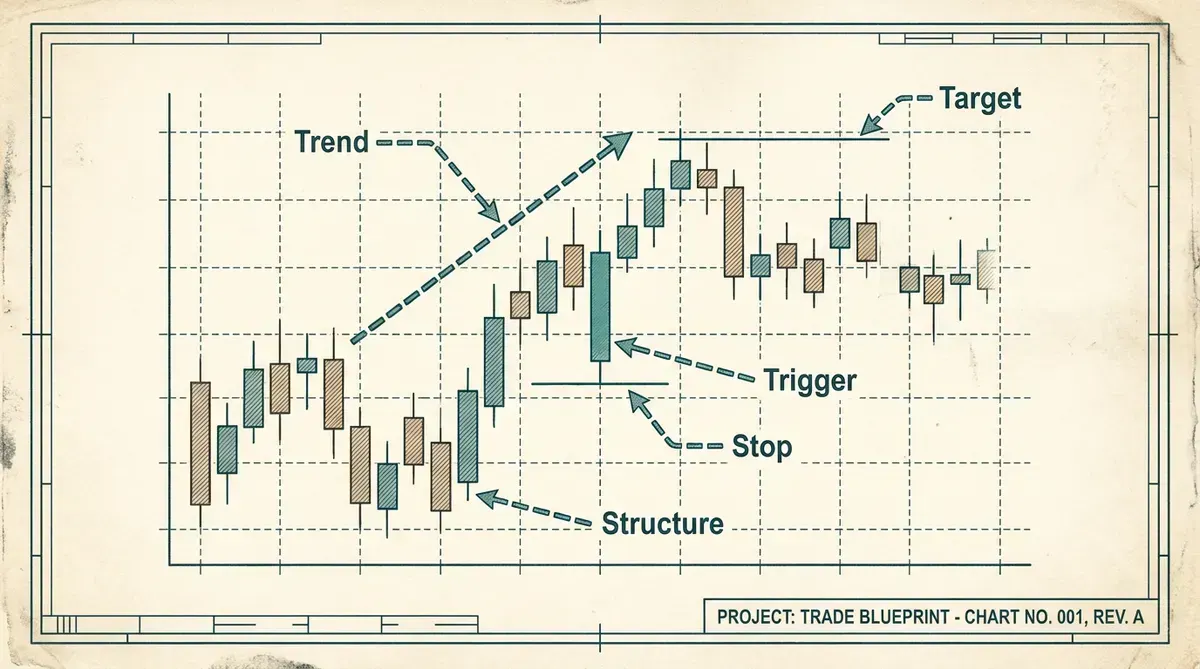
The most important mental shift in trading is this: you don't trade stocks, you trade setups — repeatable situations where the market's structure gives you a definable risk, a plausible reward several times that risk, and an entry signal that tilts the odds. The stock is almost incidental; the structure is the trade.
Every complete setup answers five questions before a dollar is committed:
- Context — is the environment favorable?
- Structure — what pattern defines this opportunity?
- Trigger — what exact event says "now"?
- Stop — where is this trade proven wrong?
- Target — is the reward worth the risk?
Let's build each layer.
Layer 1: Context — trade with the current
Before looking at any pattern, check what it's floating in:
- The stock's own trend. Long setups work dramatically better in stocks above their rising 150-day moving average. You're buying a dip in strength, not catching a falling knife.
- The theme. Stocks often move with economically connected businesses, not only with their formal sector peers. A pullback setup can be assessed alongside the companies exposed to the same technology, demand driver, or value chain. Broad participation across that theme provides different context from a setup that is isolated to one stock.
- The market. When the indexes are trending up, long setups follow through; when they're falling, even perfect patterns fail at miserable rates. The best traders' first question each evening isn't "what do I buy?" — it's "should I be buying at all?"
Context is the unglamorous 50% of the edge. Skip it and the prettiest patterns betray you.
Layer 2: Structure — the three patterns that matter
You could study a hundred patterns; three cover the vast majority of quality swing entries. What unites them: each has a shape that tells you exactly where you're wrong.
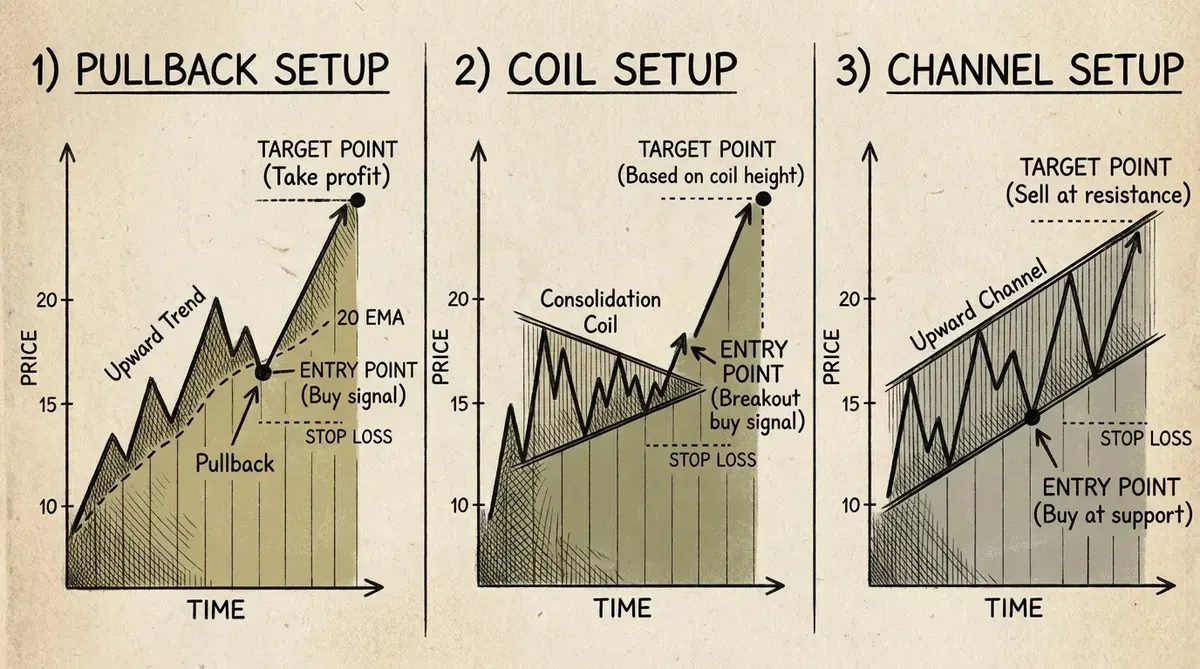
The pullback. A trending stock dips a few percent back to a rising moving average or prior breakout level, on declining volume (relaxed holders, absent buyers — not fleeing institutions). It's the market offering the trend at a discount. This is the highest-probability setup in most conditions and the one to master first.
The coil. After an advance, price tightens into an ever-narrower range while volume dries up — indecision compressing like a spring. The eventual break, on expanding volume, frequently travels far. The tight range is a gift: your stop sits just inside it, so the risk is tiny relative to the potential move. (The breakout version of this is covered in depth in How to Find Breakout Stocks.)
The channel. Some trends advance in a remarkably orderly rising channel, touching the lower line, rallying to the upper, and repeating for months. Buying near the lower line of an established upward channel gives you a defined stop (just below the channel) and a pre-drawn target (the upper line). The pattern even tells you when to be cautious: a stock at the top of its channel is a poor fresh buy no matter how strong it looks.
Layer 3: Trigger — evidence, not anticipation
A structure alone is a watchlist item, not a trade. The trigger is the observable event that converts it:
- For pullbacks: the first strong up day off support — price reclaiming short-term levels, ideally with volume returning.
- For coils: the actual break of the range on expanding volume — not the day before, however tempting.
- For channels: the bounce off the lower line, confirmed by a close back in the channel's direction.
Buying before the trigger ("it's about to bounce") converts a high-probability system into a guessing game. The trigger costs you a slightly worse price; it pays you a much better win rate. That trade-off is the whole profession.
Layer 4: The stop — where the market says you're wrong
Every structure above implies its own stop: below the pullback's swing low, inside the coil's range, under the channel's lower line. The principle: the stop goes where the pattern is objectively broken — not at a round number of dollars you'd "feel okay" losing.
From the stop comes size, mechanically: risk budget (say 1% of account) ÷ distance to stop = shares. A tight, logical stop lets you take a meaningful position with small risk; a distant, arbitrary stop forces tiny positions or big risks. This is why professionals obsess over structures with close invalidation points — tight stops are leverage on being right.
Layer 5: The target — and the arithmetic of walking away
Before entering, locate the realistic destination: the prior high, the channel top, the next resistance shelf. Measure it against your risk. Under 2R potential, walk away — not because the trade can't work, but because a strategy of sub-2R trades cannot survive a normal win rate. Passing on decent-but-not-good trades is a profit center.
One more pre-flight item, always: the earnings date. A flawless setup reporting earnings in three days is not a setup; it's a coin flip wearing a costume.
The full pre-trade checklist
- Market trending up or at least stable?
- Stock above its rising long-term moving average?
- Is the relevant theme showing participation across related companies, rather than relying on a single isolated move?
- Recognized structure (pullback / coil / channel) with volume behaving correctly?
- Trigger fired — actual evidence of buyers?
- Logical stop, close enough for a meaningful position at 1% risk?
- Realistic target ≥ 2R?
- No earnings inside the intended holding window?
Eight yeses. It sounds bureaucratic; it's the opposite — the checklist is what makes trading calm. Every trade becomes an instance of a process, not a fresh emotional adventure.
Finding the eight-yes candidates
Here's the honest arithmetic: on any evening, a few thousand US stocks contain maybe a handful of setups that pass all eight checks. Finding them by manual chart-flipping is a two-hour nightly job, which is why most traders end up trading whatever crossed their social feed instead — the exact opposite of selectivity.
Relaxfolio helps organise the sweep through a plain-English question. "Pullbacks" returns uptrending stocks near their moving averages with distance-to-support and trend strength shown. "Upward channels" returns channel candidates ranked by their position in the channel. "Breakout stocks" flags fresh coil-and-triangle resolutions with relative volume. Its theme structure then helps connect each candidate to related companies across sectors and industries, while "upcoming earnings" provides additional event context. The investor remains responsible for selecting candidates and defining the plan.
Structure, trigger, stop, target, size. Master this anatomy on one setup type, and you'll never again wonder what people mean by "trading with an edge."
Use "upward channels" to review candidates in relation to their position within the channel. Explore Relaxfolio →
This article is for educational purposes only and is not investment advice. All investing involves risk, including possible loss of principal.
Put this into practice tonight
Ask Relaxfolio in plain English and get a researched answer in minutes.
Get started